Upland Sandpiper
Bartramia longicauda
The Upland Sandpiper (Bartramia longicauda) is a bird in the family Scolopacidae. USGS maps its range in 44 of the lower 48 states, and in 25 of them it covers the whole state. Adults weigh about 5.6 oz (159 g).
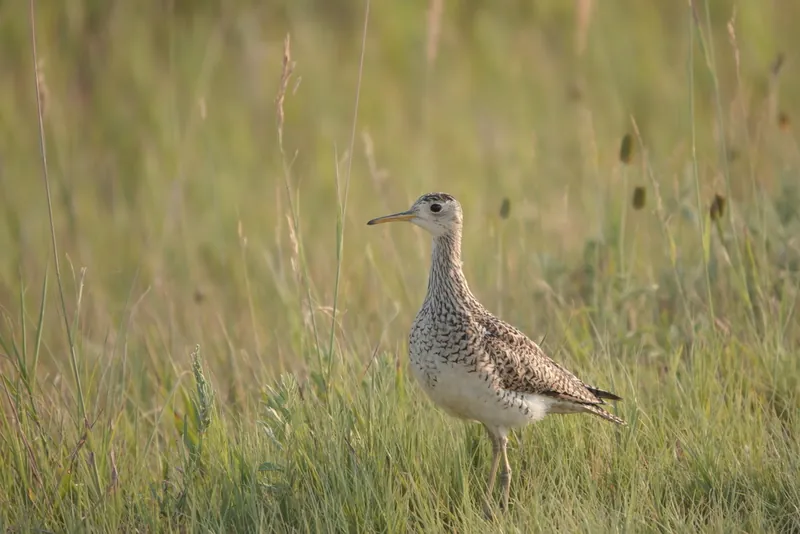
Across most of its mapped range it passes through on migration.
It is active by day. It eats mainly insects and other invertebrates. AVONET classes it as a migrant.
The USGS habitat model maps it across 49 land-cover types.
Open-licence records from the lower 48 (1,905 of them) peak in May and are fewest in November. A typical clutch is about 4. The longest recorded lifespan is 8.9 years.
By size, range and water use in the USGS models, the species most easily taken for it is the American Woodcock.
Where the Upland Sandpiper lives
| State | Share of state | Counties | Open records | Peak month |
|---|---|---|---|---|
| Alabama migration | all | 67 of 67 | 8 | |
| Arkansas migration | all | 75 of 75 | 7 | |
| Delaware migration | all | 3 of 3 | ||
| Florida migration | all | 67 of 67 | 116 | August |
| Georgia migration | all | 159 of 159 | 41 | |
| Illinois summer | all | 102 of 102 | 425 | May |
| Iowa summer | all | 99 of 99 | 334 | May |
| Kansas summer | all | 105 of 105 | 358 | June |
| Kentucky migration | all | 120 of 120 | 12 | |
| Louisiana migration | all | 64 of 64 | 75 | April |
| Maryland migration | all | 24 of 24 | 39 | |
| Mississippi migration | all | 82 of 82 | 14 | |
| Missouri migration | all | 115 of 115 | 97 | May |
| Nebraska summer | all | 93 of 93 | 205 | June |
| North Carolina migration | all | 100 of 100 | 37 | |
| Oklahoma migration | all | 77 of 77 | 105 | April |
| South Carolina migration | all | 46 of 46 | 23 | |
| South Dakota summer | all | 66 of 66 | 278 | June |
| Tennessee migration | all | 95 of 95 | 9 | |
| Texas migration | all | 254 of 254 | 526 | April |
| Virginia migration | all | 133 of 133 | 20 | |
| West Virginia migration | all | 55 of 55 | 8 | |
| Montana summer | all | 56 of 56 | 67 | June |
| North Dakota summer | all | 53 of 53 | 340 | June |
| Wisconsin summer | all | 72 of 72 | 187 | May |
| Ohio summer | 95% | 86 of 88 | 675 | May |
| Michigan summer | 89% | 79 of 83 | 128 | |
| Minnesota summer | 89% | 85 of 87 | 272 | June |
| Indiana migration | 83% | 80 of 92 | 115 | |
| New Jersey summer | 82% | 21 of 21 | 28 | |
| Pennsylvania summer | 69% | 53 of 67 | 141 | May |
| Rhode Island summer | 64% | 5 of 5 | 22 | |
| Colorado migration | 62% | 42 of 64 | 36 | |
| Wyoming migration | 61% | 19 of 23 | 11 | |
| New York summer | 53% | 52 of 62 | 249 | August |
| Maine summer | 34% | 12 of 16 | 73 | |
| Massachusetts summer | 32% | 9 of 14 | 117 | |
| New Mexico migration | 30% | 15 of 33 | 12 | |
| Vermont summer | 29% | 8 of 14 | 32 | |
| New Hampshire summer | 18% | 4 of 10 | 44 | |
| Connecticut summer | 11% | 1 of 9 | 37 | |
| Oregon summer | 9% | 8 of 36 | 6 | |
| Idaho summer | 5% | 8 of 44 | 20 | |
| Washington summer | under 1% | 1 of 39 | 1 |
Share of state is the part of each state inside the range map. Counties counts those with at least a tenth of their area in range. A state link opens that state's full list.
When it is recorded
Species it can be taken for
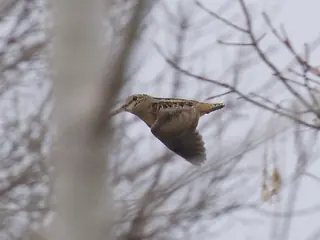
Chosen by rule: the same group, an adult size within 30%, at least one shared state and the same water use in the USGS habitat models. It is a list of candidates, not an identification.
Sources
- AVONET: morphological ecological and geographical data for all birds. CC BY 4.0. Read 2026-11-15.
- Amniote life-history database. CC0. Read 2026-11-15.
- EltonTraits 1.0. CC0. Read 2026-11-15.
- GBIF Backbone Taxonomy. CC BY 4.0. Read 2026-11-15.
- GBIF occurrence records under CC0 and CC BY 4.0. CC0 and CC BY 4.0 per record. Read 2026-11-15.
- Integrated Taxonomic Information System. CC0. Read 2026-11-15.
- US Census Bureau cartographic boundary files 2023. Public domain (US Census Bureau). Read 2026-11-15.
- USGS GAP 12-digit hydrologic unit range units. Public domain (USGS). Read 2026-11-15.
- USGS Gap Analysis Project Species Habitat Maps CONUS_2001 (model parameters). Public domain (USGS). Read 2026-11-15.
- USGS Gap Analysis Project Species Range Maps CONUS_2001. Public domain (USGS). Read 2026-11-15.
- iNaturalist photographs under CC0 and CC BY. CC0 and CC BY per photograph. Read 2026-11-15.
How each figure is derived is set out on the methods page.